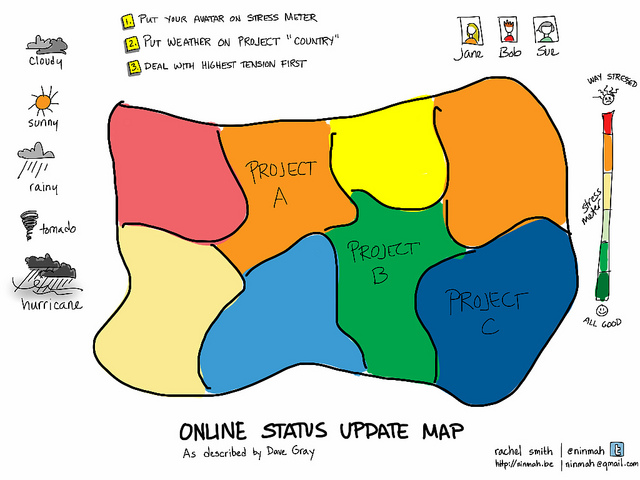
Browsing Rachel Smith’s blog today I came across this terrific idea. She was building on an idea of Dave Gray (of Brainstorming fame) to help people share their current state. Sort of a project emotional barometer. I love things that help us visualize and make discussable this often “internal weather.”
Project Map | Flickr – Photo Sharing!.
I can imagine putting the image up on a webmeeting white board.
John Smith introduced me to a barometer for the ongoing health of a community of practice which I really liked. What this one does is taking it a step beyond simple data collection and add the emotive element.

This is a great starting point for the collaborative drawing idea mentioned in your previous post Nancy. As a participant in the upcoming Change11 MOOC I am apprehensive about the volume of content I know is going to come my way, but also excited about the opportunities that the networking provides. I am reporting on my experience for an assignment in a subject that I’m taking at the University of New England, so that aspect is stressful as well.
What I’m interested in is how new-comers to a MOOC might find their way through the content, and what can be done to support them in making the most of the opportunity. What I am starting to understand is that the emotive element provides an insight into when participation in the course becomes participation in a community, moving from the periphery to the centre.
I’m interested to see how this barometer concept develops.