Graphic Facilitation and Sense Making > The Sum of its Arts

What follows is a mish-mashed report on an online event from December 2014. I know better than to procrastinate this long…

Last month Laurie Webster invited me to do a web gathering with her as part of a free series she has been offering. She is a pro with all sorts of quantitative processes and particularly the use of Sense-Maker ®. I like the way she thinks/does and she was totally open to a wild-hair experiment. I was not offering to share what I KNOW, I wanted to think together about what is tickling my brain.

Our pitch was simple: come play and think out loud with us.

Join me and Nancy for a fast-paced event that promises to be both practical and playful. Nancy will begin by describing how she uses visual methods in a variety of facilitative settings. Then we will discuss how these methods can both supplement and complement sensemaking and the use of SenseMaker®. The real fun will begin when registrants are invited to join Nancy in the sandbox for a real-time, “safe-to-fail” experiment using a shared online drawing tool.

Her clever partner, Stephen DeLong came up with the most imaginative title, Sensemaking + Graphic Facilitation > The Sum of its Arts. I bow down to this cleverness, and it well expresses the idea that Laurie and I had been wondering about: what is the role of visuals in the sensemaking process.

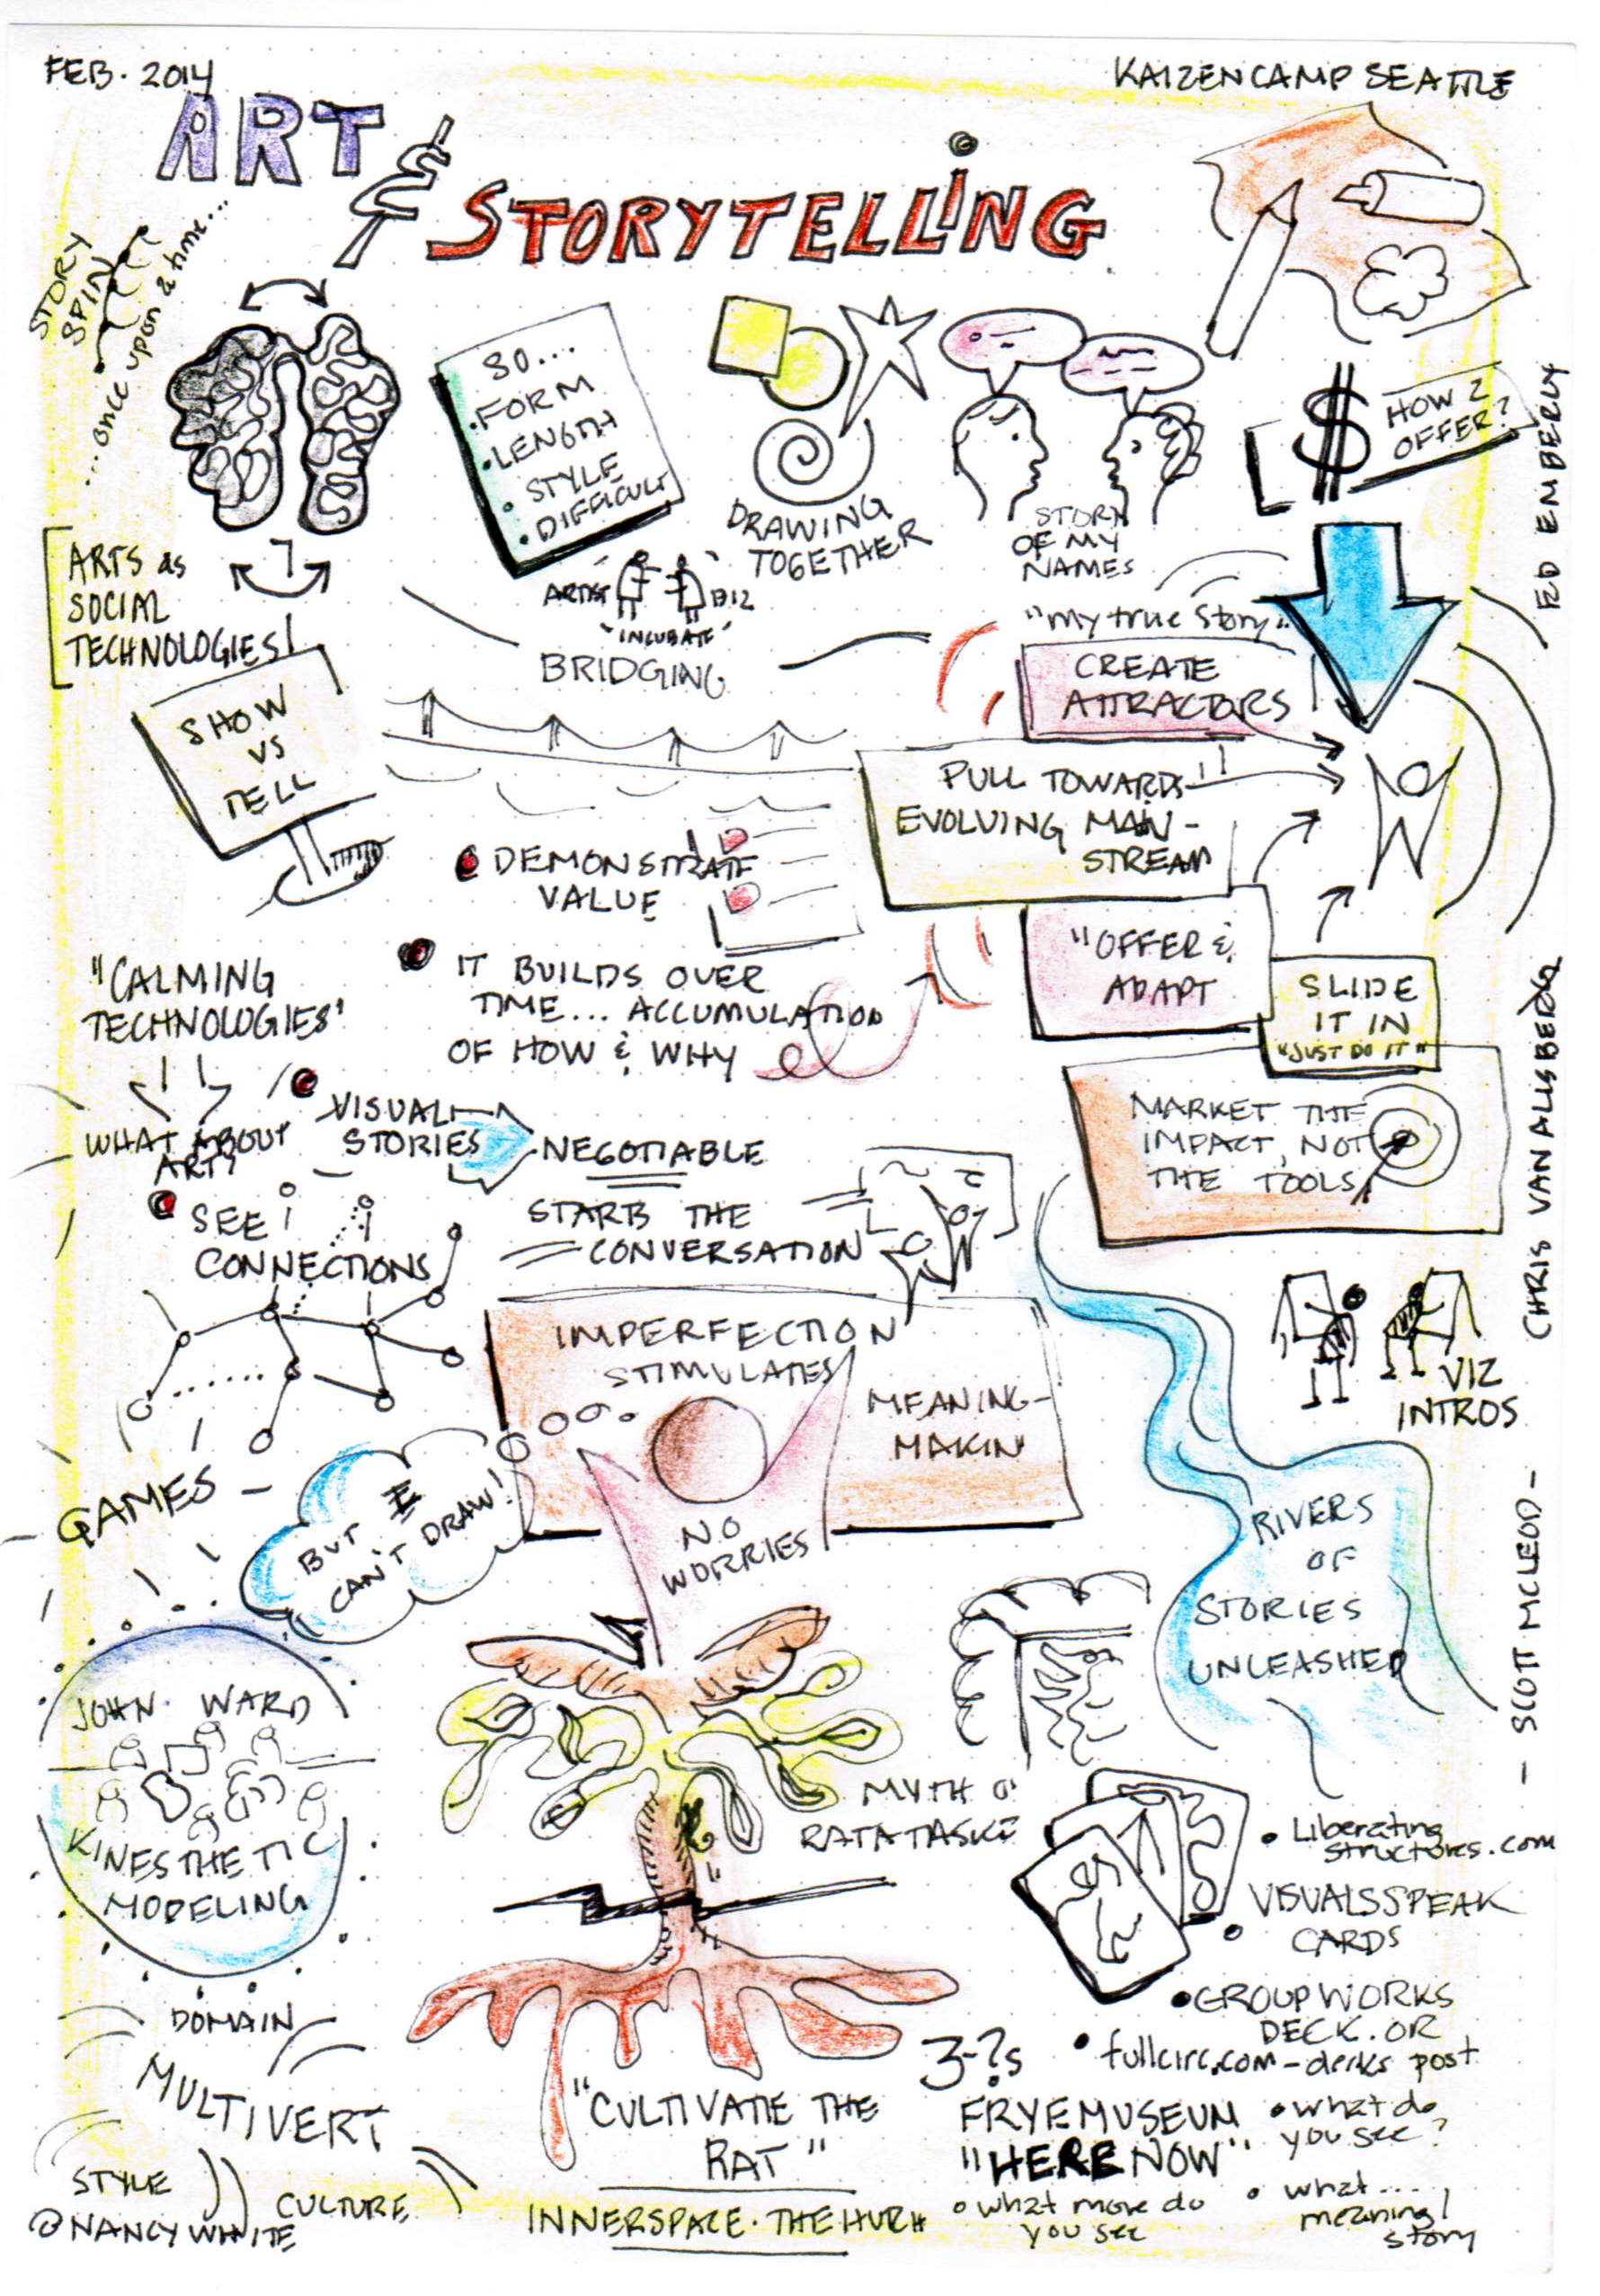
We started by introducing our fields – graphic facilitation, and sensemaking. Of course, I was being a goofball as usual. This is deliberate. Low status body language with high status verbal language = people listen differently. They can’t quite pin things down from past experience, so they are open. Thank you, Viv McWaters! That insight you shared a few years back at the Applied Improvisation conference has borne much fruit!

I’m a huge fan of graphic recording and graphic facilitation. Visuals are powerful tools. By that I mean all those wonderful things like pictures can initiate great conversations, they aren’t so explicit that we can assume we understand so we ask each other questions, “tell me the story” here, etc. Visuals are openers.

At the same time I have become increasingly troubled when I sense that MY drawing is actually taking sensemaking agency away from the people I’m supporting. My drawing, as hard as I try to be a faithful, neutral reporter, still carries my interpretation. It is what I hear and how I make sense of that. Sometimes my interpretation and synthesis can be useful. But when the drawing (or other visual approaches such as photo cards, collage, Draw With Me, etc.) is in the hands of everyone, we can both take advantage of the power of visuals, and disintermediate the sensemaking. Tracy Kelly picked up on this topic and posted a very thoughtful blog post on “Graphic Recording: how to disintermediate.” Do hop over and read it!

Combine this with the work that Laurie and her colleagues have been doing with sensemaking through the use of narrative fragments, we start getting some interesting “science fair experiments.” We started wondering out loud if people can draw their narrative fragments and if we could apply sensemaking processes to those visual fragments.

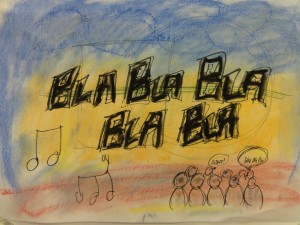
The jumping off point is we have to be comfortable drawing our silly little stick figure pictures. Oh, how repressed we are about drawing in public. So we dumped everyone into a drawing environment. No hiding!

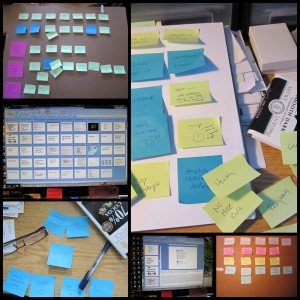
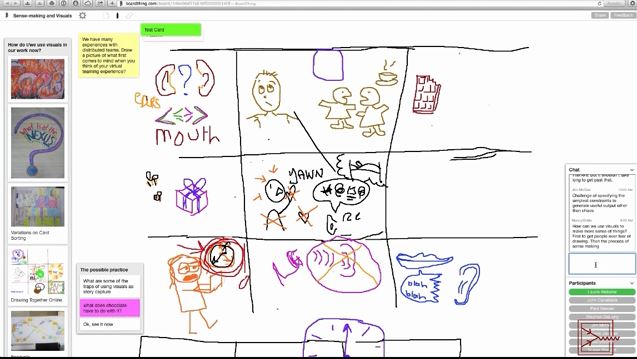
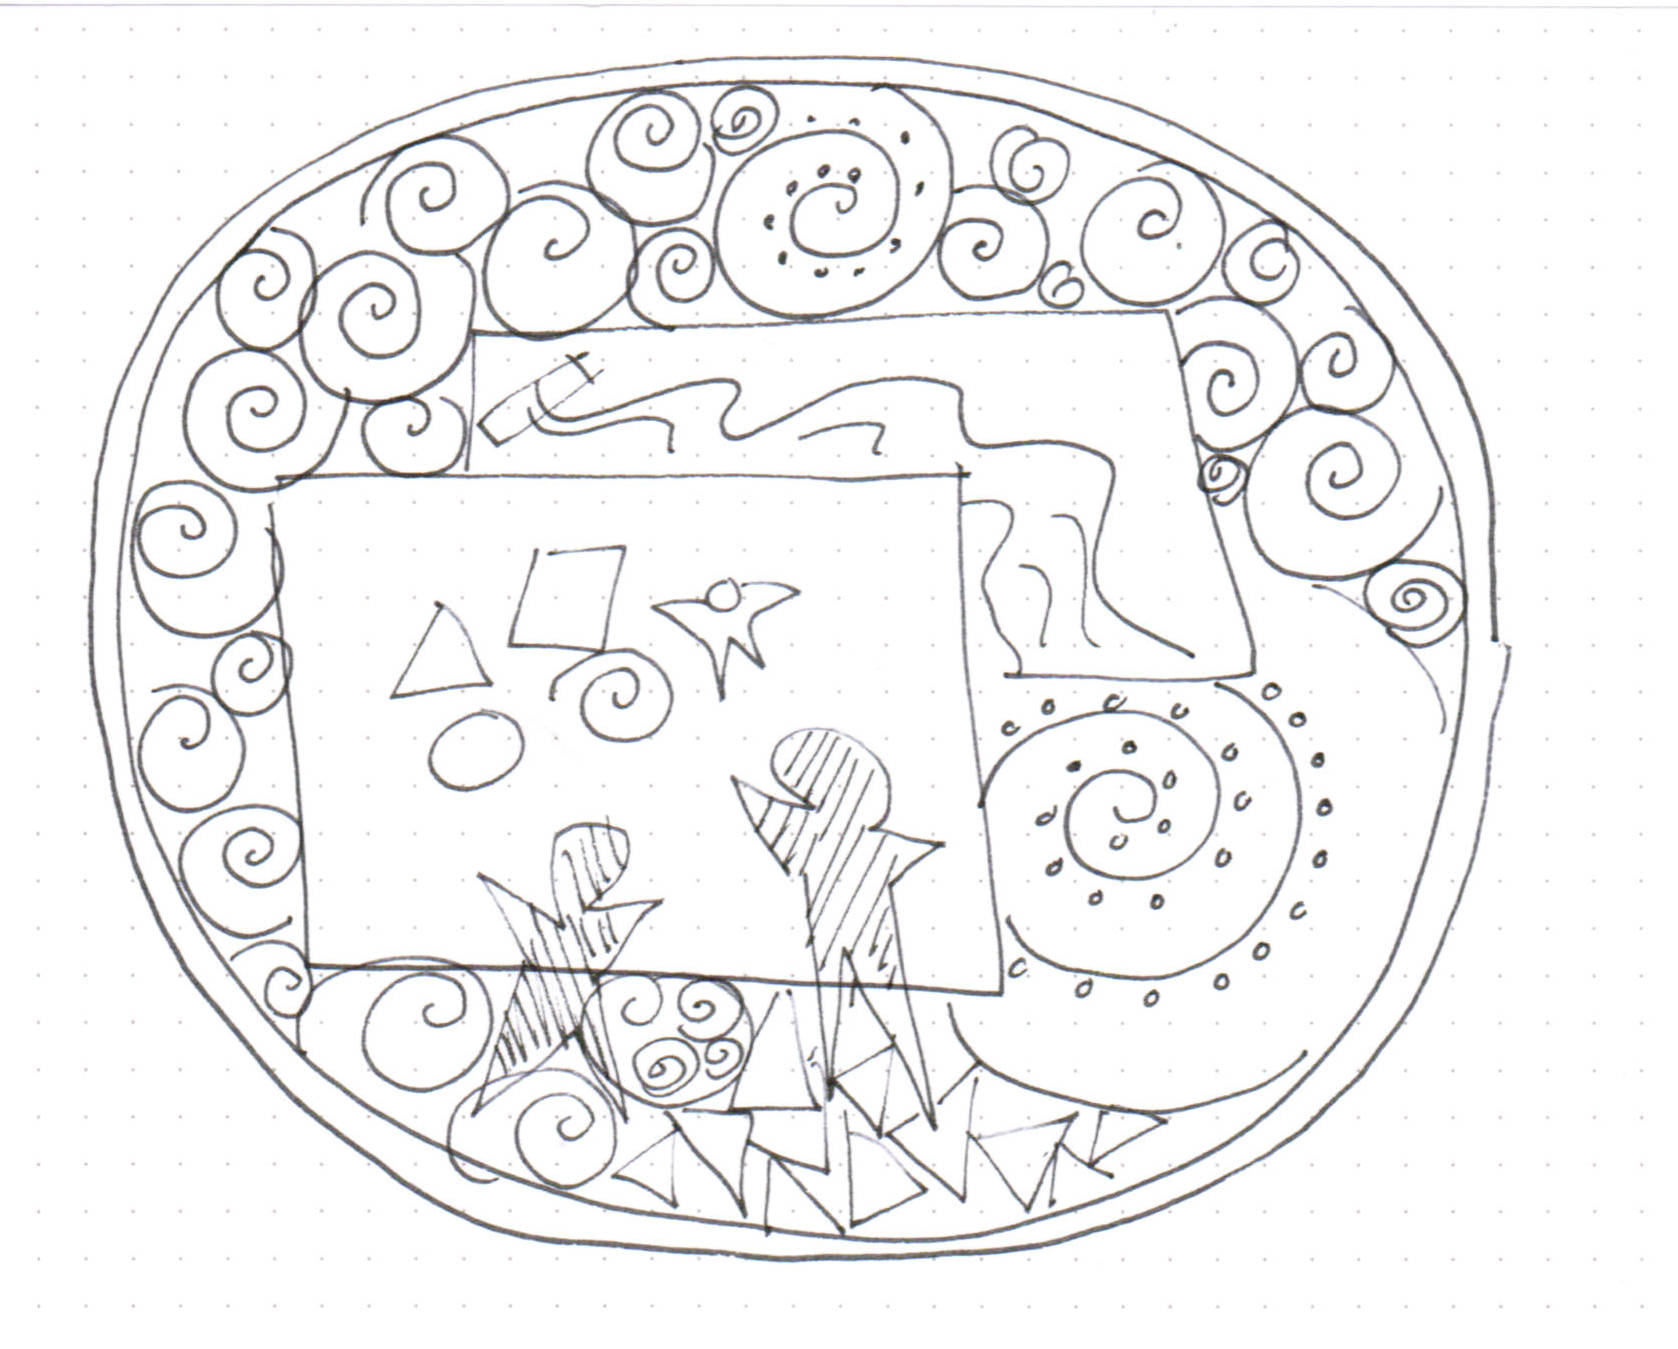
The real fun started at about 30 minutes in. You can see a video of the whole process here, but you must register and log in. There is a 1 minute teaser for those of you who don’t want to register. (I understand!) We left the “webinar” environment and moved to BoardThing, a wonderful invention of Dave Gray and friends. We accidentally erased all the drawing we did, but I’ll share a few screenshots below. I wanted to not just TALK about participant-generated visuals, but to DO them.

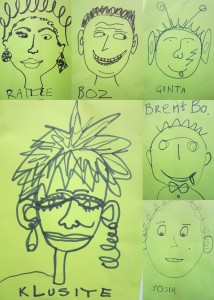
First we introduced some of the functionality of Boardthing, which is a wonderful mash up of online card sorting, a shared whiteboard and a chat room. (The chat of the event is attached for your reading pleasure. ChatFromDecVizSensemakingWebinar ) We did a wee bit of card sorting (on the left of the screen shots). Then I invited a group of 9 people to start drawing on the whiteboard. We then debriefed from both the drawers’ and observers’ perspective. If you peek at the transcript, you will see that this first round was not particularly comfortable for those drawing, and a bit hard to make sense of by the observers. Then I sketched in a grid and gave a second, more focused drawing prompt. The images came faster and were easier to use to engage in the sensemaking process. We then chatted about the power of constraints!

SensevizExp1SensevizExp2SensevizExp3


The hour flew by and we did not come to any momentous insights, but based on page views of the video and followup emails Laurie has received, I think we hit on something resonant. I’m not sure what to do with it next, but I plan to think/play/experiment some more. There is some distance to travel between the whole “getting people drawing” thing, and the more sophisticated sensemaking processes. My main conclusion is that using the drawings helps prevent people from prematurely coming to interpretations and conclusions. There is sufficient ambiguity to stimulate us to learn more and dive deeper, and sufficient novelty to shake us out of our “thinking ruts.” That’s good stuff. The question now is how to apply these insights usefully. For sure, it will be fun.

Finally, Susan Stewart recently started a Facebook group about webinars and reflected a bit on the process. She said it was OK to share here!

 Susan Stewart’s reflections

Just finished the webinar with Nancy White … she’s such a willing risk-taker. (We used two platforms: GoToWebinar and BoardThing (in Beta) – BoardThing for drawing together.) Many take-aways from the webinar, I will share two and I hope others who participated will share some, too!

1. TRY DRAWING: I have used white boards for things like having folks write their thoughts, plot the intersection of their previous learning experiences and their comfort with current content, dragging their name to a chair as a way of taking role and letting them claim a space in the conversation (Thanks, LaDonna Coy!)… I have not invited folks to draw…but I think I will try giving them a prompt and some instruction on how to use the tools, then invite observations by those not drawing and also by those who have done the drawing.

Interestingly, this is not about high quality art, but about iconic scrawls. Even the most rudimentary images can represent some profound understandings.

Nancy noted that drawing sometimes allows things to emerge that otherwise might not have – even the drawer may not be cognizant of what is coming forth until it is there. She did share that this can be quite powerful and suggests setting up the situation with much thought and being prepared with how to respond if strong emotions are triggered.

I think we had 47 people on the webinar from all over the world. Nancy, what is your take on the level of engagement by all participants…those drawing, those commenting and those observing? (That last group is hard to assess.) I know we had two groups of about 9 each drawing.

2. TAKE RISKS: Nancy made a comfortable environment for us to explore in. She took risks with us and was willing to deal with surprises. That spoke volumes to me about how important it is in online meetings and participatory webinars to step away from the presentation and allow time and room for mucking about together with the participants.

My experience in learning about online meetings and webinars has been mostly about exploring and risk taking. That’s one of the reasons I started this group. I learned by getting in the sandbox with others and trying things out. I’m glad that Nancy invited us into her sandbox today and I hope you’ll feel comfortable asking us to take risks with you. I feel confident that as a group we will continue to find ways to engage with participants that are creative and meaningful.

The invitation to the sandbox is open!

Art, Brains and Awe

Stephen Downes posted this link in his OLDaily today. Take a moment out of a busy day and look at the images that Greg Dunn has created from images of the human brain. This quote says it all:

Image from Gregg Dunn

Through his art, Dunn hopes to give voice to scientists whose work usually isn’t appreciated by the general public, he said. “Art has the power to capture people’s emotions and inspire awe [in a way] that a lot of charts and graphs don’t have.” Credit: Greg Dunn

via Dazzling Images of the Brain Created by Neuroscientist-Artist.

My Harvest from a Half Day at Seattle #Kaizencamp

Thanks to a serendipitous conversation with friends im Benson (@ourfounder), Tonianne DeMaria Barry (@sprezzatura), I was able to pop in for 1/4 of the Seattle #KaizenCamp. If I were pitching a Hollywood script, I’d say “Open Space” meets “Lean Coffee” meets “Liberating Structures.” A group of smart, engaged people conversing about ways of working in a lovely place (The Foundry) with good food and coffee.

I sat at two rounds of “lean coffee,” one about Storytelling and the Arts, and one about Knowledge Sharing. I made a couple of sketch notes and captured some of the resources and I wanted to get them up and out, tagged and tweeted, before I rushed on to the next thing. (Rushing— sucks!) So here we go…

Storytelling and the Arts

KaizenCampArtStorytelling


URLs/Resources Shared:


Knowledge Sharing

KaizenCampKnowledgeSharing


URLs/Resources:


Visual, Poetic Recap of Climate Change Report

From Sightlinesvisualize it
help us see our world clearly
maybe we WILL act

Wow, Gregory Johnson, you are a gift to the world. Scientist, poet and artist Johnson distilled the massive IPCC Climate Change report into a series of illustrated haikus. You can see and download this fabulous material on the Sightlines site (another great resource – hey, give them a donation!)

From the Sightlines article:

Condensing to this degree is not how scientists typically operate. But, as Johnson proves, scientists can also be poets. Still, he’s quick to caution that this is his own unofficial artistic interpretation and that it omits all the quantitative details and the IPCC’s scientific qualifications.

The Entire IPCC Report in 19 Illustrated Haiku | Sightline Daily.

Getting Ready for Graphic Facilitation at ILO’s Turin Training Centre

NorthernVoice2012This month I’m getting to share a day’s worth of graphic facilitation practices with the good folks at the International Labor Organizations Torino (Turin) Training Centre. In preparation, my colleague from the Centre, Tom Wambeke, asked me to answer some questions for their blog. It is interesting to try and organize one’s thoughts on such a huge subject. And to make sense at the same time! I’m doing a dry run here, so feedback is appreciated! The questions are his. I also realized I have a ton of great images that are NOT organized and easily accessible. Hmmm….

1. What is visual facilitation all about ?

Graphic or visual facilitation is the intentional use of visual practices, including drawing, using pre-made visual artifacts and other forms, by an individual or by members of the group to support the group’s process. Some of the intentions behind visual facilitation include:

  • using visuals as sense-making tools
  • using the negotiability of images to think together when words (written/spoken) may block us
  • the value of people creating a shared artifact of their work/learning/experienceIMG_0868
  • the power of “making my mark” as an individual in a group
  • using as many of our senses as is useful in a particular context

Graphic facilitation is different from graphic recording, which is the visual capture of what is being said in a room. We can use graphic recording as a way to enhance and facilitate meetings, but with graphic facilitation we are using visuals to enhance all the processes in the room. So it is less about making something beautiful, but to make beautiful interactions within a group. In the Centre’s case, this might mean making beautiful learning!

Finally, while drawing is a key element of graphic facilitation, it is NOT the only thing. We use visuals such as post it notes for learners to take ownership and write and move their own ideas. We vote with colored dots. We use “red, yellow, green” cards for real time presentation feedback. The ideas from Gamestorming by Dave Gray (and this nifty Gamestorming design kit by ). These are all visual methods. AND, you don’t have to be an artist even if you ARE drawing. Look at the amazing work of Dan Roam and Mike Rhode who inspire even the most rudimentary doodlers in us.

2. Why is it important?

DSC01558
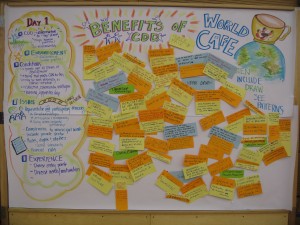
There are many reasons visual facilitation is important. First of all we have the cognitive value. Our human brains react not just to words (spoken or written) but to images, sounds and even the kinesthetic experience we have as we interact with each other. So including the visual aspects into learning and doing things together enhances a group’s practice and results.

Second, visuals help us both in meaning making and in our working relationships with each other. I work internationally a lot and I’ve found visual facilitation does some wonderful things around the issues of power and language. Pictures, unlike words in so many cultures, are often perceived as less precise, or negotiable. When someone says “blah blah blah blah” we tend to either THINK we understand them, or if we don’t we may resist saying something at the risk of “looking stupid, ” especially in contexts of power and in hierarchies. We may not even be listening.

When someone doodles a little picture on a napkin or flip chart, we sit up and take notice. We begin to wonder, ESPECIALLY if it is imperfect, and we can more easily say “what do you mean by that.” We have gone into the place of discussability and negotiation of meaning, the place of learning and understanding. This is a HUGE benefit to groups. Wonder can jump start listening and deeper conversation.

Discussability also helps bridge linguistic gaps. When we are working with groups who do not share a home language, we can miss meaning. The pictures slow us down just enough to find out if we are or are not talking about the same thing.

Finally, there is something about visuals that raises the energy in a room, helps us focus our attention and is just plain FUN. This supports engagement, ownership and, well, I’ll say it again, contributes fun. I think that is real and legitimate so I’m not afraid to say that three letter word. FUN!

So we get cognitive benefits, we get power-leveling benefits, we get meaning making benefits, we increase engagement and we have fun. THAT is a lot of value! If you want more peeks into this sort of thinking, check out Nancy Duarte’s “Resonate” – there are some bits online and the following link has some great videos. http://www.duarte.com/book/resonate/#www

3. We live in a visual world and up to today training is still very much relying on text-based materials and facilitation aids.What added value can visual facilitation bring to a training Centre?

Beyond making learning beautiful? 🙂 Let’s start with the one people often least expect: listening. I want to share a great quote from Avril Orloff, an amazing visual facilitator and one of my mentors, about the role of visuals in listening.

“Any event that convenes a conversation == whether it’s a strategic planning session, a community engagement process, a workshop, or a dialogue between stakeholders — is only as successful as the quality of the listening taking place. “

VictoriaPictures
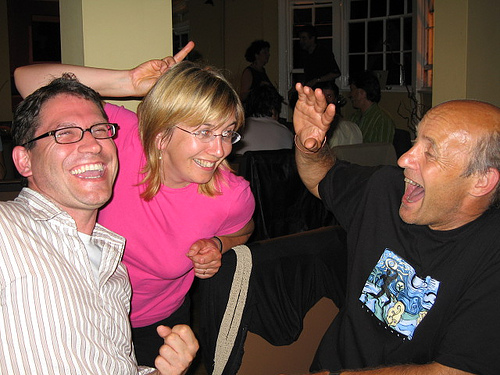
We often think of the visuals as the content of the curriculum, but they are also “receptacles” of interaction. They can be a rich part of our process. Visuals help both the teacher and the learner to listen to each other and, when the conversational artifacts are captured as a visual practice, to show that people have been heard. We can use them between participants to foster better small group work, especially with people who are shyer to talk, or may need to stimulate other parts of their brain to engage and learn. Consider what would happen if you captured learner feedback on a white board visually (not just words) to help understand their understanding, and to demonstrate your listening as a teacher — what kind of a reaction might you expect from the learners? I bet it will be very gratifying and enlightening. I often use paired drawings  (learned from Johnnie Moore) between participants as a way to get to know each other and engage in deeper conversation.

Second, think about visuals to frame content, process and meaning making. I’m not just talking about making your PowerPoint presentations more visually attractive. That is certainly a benefit (see how I drew my slides here), but I think it is important to think about visuals changing HOW we teach and learn and certainly step beyond presentation and delivery of content as the center.  Here are just a few of the many things you can do.

      • Visuals can be an amazing way to plan your curriculum.  I’m really enjoying how the folks at Liberating Structures have used what they call Design Storyboarding . (You even have an example on your blog where Tod Harple said “I was also being very visual–rolling a whiteboard into her office so that we could “visualize” as we thought out loud. In this way, we were able to quickly frame the key components of the results and consider the narrative or story of how we would express them. (http://itcilo.wordpress.com/2013/05/24/interview-hosting-todd-harple-intel-experience-engineer-at-itc-ilo/#more-999 ) We can use  a visual time line to provide a course overview to show sequence, or even options and alternatives.  We can use a visual “make your own” agenda with post its for learners to suggest and prioritize what they want to learn. (Post Its, flip chart, pens… voila!)

Prepping for my KM Singapore Keynote

  • Visuals can be part of interactive practices with small and large groups. A human spectrogram is both visual and kinesthetic, yet never lifts a single pen, all the while the group is helping making its insights or knowledge “visible” to you and to each other! Visuals are particularly good at helping draw out ideas. Check out “Drawing Together.”  This quote from that page is too good NOT to share.

“Drawing together makes it possible to access hidden knowledge. Hidden knowledge may include feelings and patterns difficult to express with words. When people are tired, their brains are full, and you have reached the limits of logical thinking, drawing together can evoke ideas that precede logical, step-by-step understanding of what is possible. Stories about individual or group transformations can be told with five easy-to-draw symbols. Each symbol has a universal meaning.  Being playful signals you are allowing for unlimited possibility and many right answers. Over-reliance on writing and what people say can limit novelty!”

Visual practices can be a key element in reflective and evaluative processes. Think about visuals as a way to test and apply ideas. You can use card sorting exercises and dotmocracy to help learners sift and make sense of content. You can do a visual reflection exercise with the River of Life  (we may use this to evaluate our time together in Torino!) You can have learners map their next steps – literally.

Finally, when we think of ourselves as teachers, visuals ask us to step out of our possible “ruts” of the strings of words we have gotten so good at delivering. They ask us to challenge our own thinking and express ourselves in new ways. That often triggers new insights for ourselves, not just our students. Visuals are a discovery pathway, even a vector for innovation.

4.  Three books to read?

DSCN0239

These days, I’m torn to pick three. I want to rebel! I probably would put different books every day of the week, but here goes… (AND look at the larger list linked here!)

 5. Three must read articles?

Oh, Tom, this is really no fair! There are so many aspects to the practice, and it is blossoming right now, so there is something interesting everyday. I’d suggest people join the RosViz10 group where we link stuff as it emerges. https://www.facebook.com/groups/122858401095871/ Then they can be “in the flow” with the rest of us. The Graphic Facilitation group is also terrific https://www.facebook.com/groups/2708716559/.

6. Two must see websites?

The International Forum of Visual Practitioners is the professional development hub http://ifvpcommunity.ning.com/  and The Center for Graphic Facilitation is another great aggregator of emerging material across the practice http://graphicfacilitation.blogs.com/  There is also a strong European community, but I’m less well connected to them. I’m asking my network for their recommendations and will let you know. And of course, my crazy little wiki of resources http://onlinefacilitation.wikispaces.com/Visual+Work+and+Thinking

I also have a bit more linked here.